We are the best partner for research


Normative
神経生理学的
正常人データー

database

Why do you need biomarkers?
Psychologists rely on psychometrics to measure personality, pathology, motivation, and learning difficulties. However, despite the inclusion of fake scales, psychometric measures of split half design and many other clever statistical manipulations are represented by behavioral data obtained from self and other reports.
The 5th revision of the Manual for Diagnosis and Statistics of Mental Disorders (DSM-V) initially aimed to classify mental disorders according to biological markers. Due to the negative reaction to practice and the fact that there are still some uncertainties, the authors of the biomarker approach decided to defer incorporating the approach into DSM until the sixth revision. The new approach presupposes that psychiatric diagnoses are based not only on behavior, but also on knowledge of which brain system is impaired. It is almost certain that it will be widely accepted because the biomarker approach leads to objectivity and transparency. Like thousands of other researchers, HBImed has already undertaken extensive research in this area, setting parameters for components of quantitative electroencephalograms (QEEG) and event-related potentials (ERPs) to the critical parameters of various mental disorders. It is defined as a biomarker specific to.
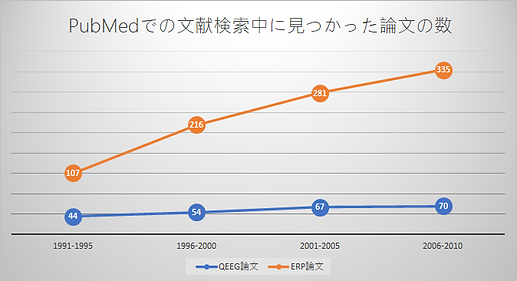
Recent studies have linked specific dysfunctions such as ADHD, schizophrenia, OCD, depression, and specific learning disabilities to specific patterns of spontaneous and evoked potentials recorded from the head by multiple surface electrodes. That, and these natural functions and especially evoked potentials, provide reliable markers of brain function and dysfunction.
Spontaneous and evoked potential measurement data can be compared with data from normative databases (eg, Human Brain Index Reference Database (HBIRD)). By comparing the data using parametric statistical methods, you can calculate the difference between the patient and an appropriate age-matched reference group. This computer analysis serves as a valuable tool to aid in diagnosis and treatment planning.

Why do you need biomarkers?
Psychologists rely on psychometrics to measure personality, pathology, motivation, and learning difficulties. However, despite the inclusion of fake scales, psychometric measures of split half design and many other clever statistical manipulations are represented by behavioral data obtained from self and other reports.
The 5th revision of the Manual for Diagnosis and Statistics of Mental Disorders (DSM-V) initially aimed to classify mental disorders according to biological markers. Due to the negative reaction to practice and the fact that there are still some uncertainties, the authors of the biomarker approach decided to defer incorporating the approach into DSM until the sixth revision. The new approach presupposes that psychiatric diagnoses are based not only on behavior, but also on knowledge of which brain system is impaired. It is almost certain that it will be widely accepted because the biomarker approach leads to objectivity and transparency. Like thousands of other researchers, HBImed has already undertaken extensive research in this area, setting parameters for components of quantitative electroencephalograms (QEEG) and event-related potentials (ERPs) to the critical parameters of various mental disorders. It is defined as a biomarker specific to.
Recent studies have linked specific dysfunctions such as ADHD, schizophrenia, OCD, depression, and specific learning disabilities to specific patterns of spontaneous and evoked potentials recorded from the head by multiple surface electrodes. That, and these natural functions and especially evoked potentials, provide reliable markers of brain function and dysfunction.
Spontaneous and evoked potential measurement data can be compared with data from normative databases (eg, Human Brain Index Reference Database (HBIRD)). By comparing the data using parametric statistical methods, you can calculate the difference between the patient and an appropriate age-matched reference group. This computer analysis serves as a valuable tool to aid in diagnosis and treatment planning.

参考論文:
Is bipolar disorder still underdiagnosed? Are antidepressants overutilized? J Affect Disord. 1999 Jan-Mar;52(1-3):135-44.
http://www.breggin.com/antidepressant-drugs-resources/ghaemi-schizoaffective-bipolar-antidepressants-1999.pdf
The HBI reference database contains multi-channel EEG recordings for the following groups:
(1) Open/closed eyes
The 19-channel EEG was recorded with eyes open (at least 3 minutes) and eyes closed (at least 3 minutes).
It is evaluated by calculating z-scores (standard deviation SD).


標準化された条件は次のとおりです。
1) EEG記録用のアンプには、帯域幅が少なくとも0.5〜30 Hzの少なくとも19チャネルが必要です。
2) 被験者は、薄暗い部屋のリクライニングされたアームチェアに快適に座っている必要があります。
3) 19チャネル安静時脳波の記録は、目を開いた状態と閉じた状態のそれぞれで少なくとも3分間行われます。
4)記録EEGは、5つの作業条件のうち少なくとも約20分間行われなければなりません。
作業条件1 VCPT:Visual Continuous Performance Task(GO / NOGOタスク)
作業条件2 数学的タスク
作業条件3 読解タスク
作業条件4 聴覚認識タスク
作業条件5 3つの聴覚オッドボールタスク
参考URL:HbimedのFDA承認状況
https://www.accessdata.fda.gov/scripts/cdrh/cfdocs/cfPMN/pmn.cfm?ID=37627
VCPT:Visual Continuous Performance Task


Various psychological tasks have been designed to assess the functioning of the brain's executive system. The HBI reference database uses GO/NO-GO tasks developed to study the sensory and executive functions of the human brain. The description of the person task is as follows: Three categories of visual stimuli have been selected.
(1) Images of 20 different animals, later called "A".
*A: Animal
(2) Images of 20 types of plants called "P".
*P: Plant
(3) Twenty different images of people of different professions, presented with an artificial "novelty, novel" sound called "H + Sound". All visual stimuli were chosen to be the same size and luminosity. A randomly changing, novel sound consists of five 20 millisecond fragments filled with tones of different frequencies (500, 1000, 1500, 2000, 2500 Hz). New tones are used and new sounds emerge unexpectedly (probability: 12.5%). Set the stimulus intensity measured at the patient's head to approximately 70 dB. The VCPT test consisted of paired stimulus presentations with a 1 second interval between stimuli. The duration of the stimulus was 100 ms. The VCPT exam was grouped into four blocks, each with 100 trials. For each block, a unique set of 5 A, 5 P, and 5 H stimuli was selected. Each block consisted of a pseudorandom representation of 100 stimuli with equal probabilities for each stimulus category and each trial category. Participants practiced the task before the recording started. Subject rested for a few minutes after every 200 trials. Subject sits upright in a comfortable chair while looking at the computer screen. The task must push the button with the right hand as fast as possible for all AA pairs and hold the button for the other pairs AP, PP, P-(H + Sound).

ERP波形の基本的な評価法は以下に分類されます。
まずは、この基本波形の判読方法だけでもかなりERP波形を評価し易くなります。
Go刺激P3波(ルール①)→集中力の評価
GO刺激(=ルール①)は、頭頂脳領域(Cz)から陽性:Positiveの脳電位を画像の合図Cueの後の300ms後に誘発されます。
これを略称でGo刺激P3波と言います。動物A1→動物A2のGO刺激(=ルール①)の時、一番初めに表示した動物A1の300ms後に陽性:Positive(=P3)が頭頂部(Cz)に出現するという意味になります。
これは、簡単に言いますと、脳の気づきの反応量を評価しています。
脳がどれだけ動物A1の画像に反応して、次に表示される画像にどれけ注意深く集中できていたか?を見ています。
しっかりと集中しできていれば、Go刺激P3波のERP波形の振幅はしっかりと反応しています。
しかし、不注意傾向が強い被検者は、このGo刺激P3波のERP波形が極端に低い傾向にあります。
これもNormative databaseで、健常者と比較してどれくらいGo刺激P3波のERP波形が低いか評価する事が出来きます。
.png)
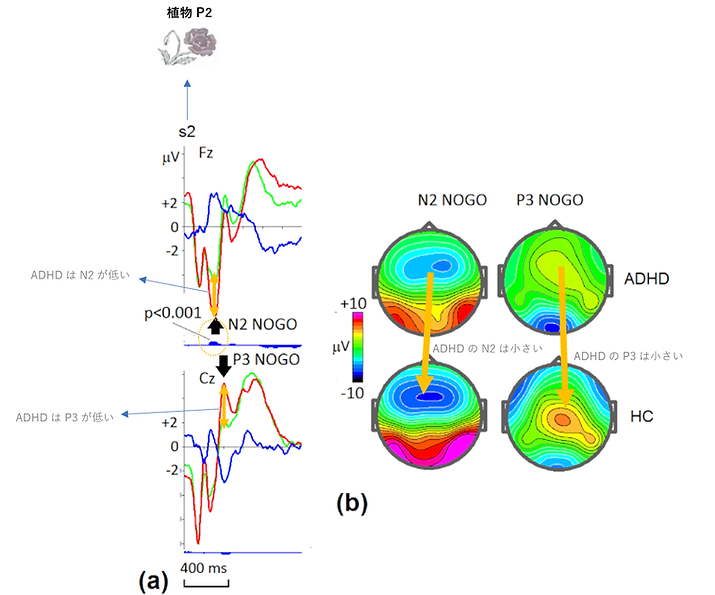
NOGO刺激N2波・P3波(ルール②)→行動の抑制を評価
NOGO刺激(ルール②)は、「ボタンを押すな」のルールに従う必要があります。
つまり、動物A1が表示された次の画像で植物P2が表示されたらボタンを押してはいけません。
動物A1が出現した200ms後に頭頂脳領域(Cz)に陰性:Negativeの脳電位が出現します。これを略称としてNOGO刺激N2波と言っています。
また、300ms後に陽性:Positiveが出現します。これをNOGO刺激P3波と略称しています。
行動抑制のレベルは、Normative databaseで健常者と比較してNOGO刺激N2波・P3波がどれだけ低いか評価できます。
ADHDのほとんどの成人の研究では、P3 NOGOは、性別年齢がマッチしている健常対照のNormative databaseと比較して小さくなっている傾向にあります。
.png)
VCPT検査は、合計で400回(約20分)繰り返した加算平均によってERPが計算されます。
この時、被験者の疲労を考慮し、200回(約10分)が経過したところで休憩する事をお勧め致します。
全体の作業時間は以下の通りです。
《VCPT検査のタイムコース》
☑️事前説明:約3前後(待合室で資料を読んで頂く事をお勧め致します。)
☑️検査前準備:約5分程度(定例のキャップ装着からインピーダンス計測)
☑️開眼3分・閉眼3分 合計6分間のレコーディング
☑️ VCPT 20分間 10分経過で3分の休憩を取る事をお勧め致します。
《合計作業時間概算》約37分
事象関連電位ERP:Event Related Potentialの関心領域は、基本的にFz・Cz・Ozです。
アルファ波の振幅は個人差もありますが50μV 前後、β波の振幅はおよそ 20μV 位であり,振幅が 50μV 以上大きい場合には異常とみなされています。
このように通常の脳波の振幅は数十μvですが、ERPはさらに極小の数μVで御座います。
従いまして、通常のレコーディング画面ではERPを肉眼では見る事は出来ません。
繰り返しランダムに施工されたVCPT検査でのERP波形を加算平均法によって自動統計され、肉眼でERP波形を観察できるレベルにフォーカスされHbimedソフトウエアで解析されます。
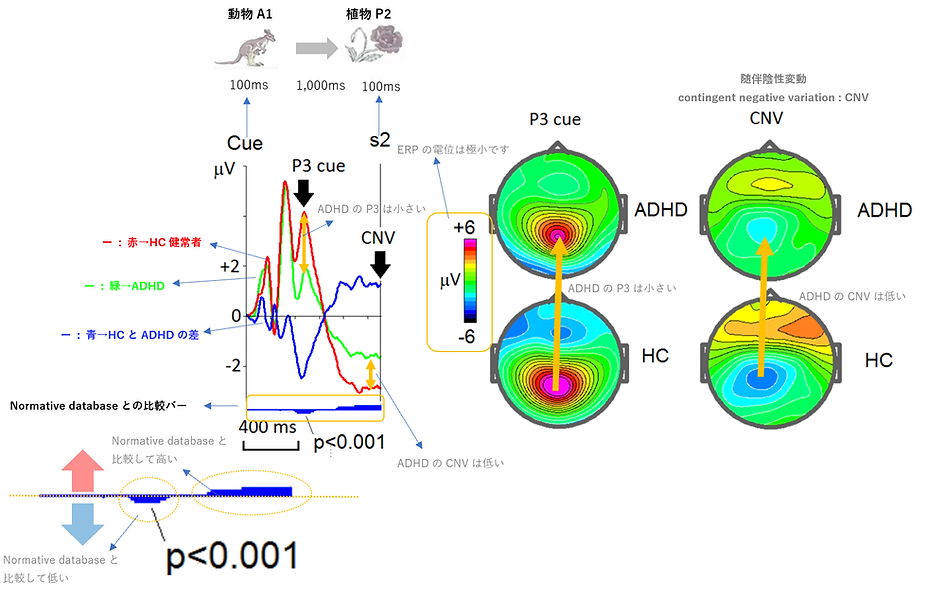
健常者HCとADHDと比較してP3波の電位がNormative databaseと比較して明らかに低い傾向があるという事が分かります。
また、随伴陰性変動contingent negative variation : CNVという陰性電位は、健常人HCとADHDと比較してADHDが低くなります。
このCNV波は、動物A1の画像が出現されて、1,000ms後の次の画像が表示されるまでのグッと被験者が構えている時に生じるP3波の後の陰性電位です。
次のが画像が来るぞ!と予告刺激の合図Cueから次の画像刺激が来るまでの陰性電位(≒CNV波)が脳の覚醒Levelや注意力を反映していると考えられている指標でWalter, Cooper, Aldridge, McCallum, &Winterらによって1964年に発見されたマーカーで、今でもADHDのバイオマーカーとして活用されているとても歴史深い有名な指標です。

ECPT:Emotional Continuous Performance Test

+トーン
Auditory Task The Auditory Task is designed to assess the electrophysiological correlates of sustained attention and auditory processing in the human brain. Instructions to the subject are shown in the figure above.
Hearing task instructions
EEG is recorded continuously throughout the task. Easily distinguishable tones of four different frequencies are used as stimuli. Each tone is displayed with either 100 ms duration (short tone) or 400 ms duration (long tone). These eight stimuli are presented sequentially in a pseudo-random order, so the proportion of long tones is about 20%. .. The stimulus start synchronization is 1100 ms. The total number of stimuli is 994. There are seven different sequences of stimuli randomly presented with equal probability. The frequency of the presented tones is randomly selected. Subject should respond to a long tone and press a button as soon as possible.
ACPT:Auditiver Konzentrationsverlaufstest


Auditory Task The Auditory Task is designed to assess the electrophysiological correlates of sustained attention and auditory processing in the human brain. Instructions to the subject are shown in the figure above.
Hearing task instructions
EEG is recorded continuously throughout the task. Easily distinguishable tones of four different frequencies are used as stimuli. Each tone is displayed with either 100 ms duration (short tone) or 400 ms duration (long tone). These eight stimuli are presented sequentially in a pseudo-random order, so the proportion of long tones is about 20%. .. The stimulus start synchronization is 1100 ms. The total number of stimuli is 994. There are seven different sequences of stimuli randomly presented with equal probability. The frequency of the presented tones is randomly selected. Subject should respond to a long tone and press a button as soon as possible.
数学タスク


Mathematical tasks are designed for the electrophysiological correlates of specific arithmetic operations and the evaluation of sustained attention in the human brain. The instructions given to the subject are shown in the figure above.
EEG is recorded continuously throughout the task. Visual stimuli are presented in pairs that correspond to trials. The first stimulus is an arithmetic equation such as "2 + 2" and the second stimulus is a number that fits the correct result of the arithmetic calculation at 50%. Therefore, there are two types of stimulus pairs, the correct one and the incorrect one. In the correct trial, the result of the arithmetic equation is equal to the number presented as the second stimulus, and in the incorrect trial, the result of the arithmetic equation is not equal to the number presented as the second stimulus. Subjects should press the button as soon as possible in response to the correct attempt and then withhold the incorrect attempt.
The duration of the first stimulus in the test is 400 ms. The duration of the second stimulus in the test is 200 ms. The interstimulus interval of the pair is 1100 ms. The interval between attempts is 3100 ms. The total number of trials is 200.
notification
読書タスク


EEG is recorded continuously throughout the task. Visual stimuli are presented in pairs that correspond to trials. The first stimulus is an arithmetic equation such as "2 + 2" and the second stimulus is a number that fits the correct result of the arithmetic calculation at 50%. Therefore, there are two types of stimulus pairs, the correct one and the incorrect one. In the correct trial, the result of the arithmetic equation is equal to the number presented as the second stimulus, and in the incorrect trial, the result of the arithmetic equation is not equal to the number presented as the second stimulus. Subjects should press the button as soon as possible in response to the correct attempt and then withhold the incorrect attempt.
The duration of the first stimulus in the test is 400 ms. The duration of the second stimulus in the test is 200 ms. The interstimulus interval of the pair is 1100 ms. The interval between attempts is 3100 ms. The total number of trials is 200.
notification
受動的3刺激聴覚課題 ミスマッチ陰性電位(MMN)


In contrast to the previous task, this task does not require the active involvement of the subject. The subject simply sits in a chair and passively listens to the test sound presented through the speaker while watching the movie (silenced) on the screen in front of him/her. This task is designed for the evaluation of automated information processing of deviant and novel stimuli in the human brain.
EEG is recorded continuously throughout the task. Three sounds act as stimuli. There is a low-frequency tone of 1000 Hz called the “standard” stimulus, a high-frequency tone of 1300 Hz called the “deviant” stimulus, and a complex sound that is new to all presentations called the “new” stimulus. The new stimulus consists of a combination of five short stimuli.
Tones with frequencies 500, 1000, 1500, 2000, 2500 Hz are presented randomly for 100ms. The interval between stimuli is 700 ms. The total number of stimuli is 2000. The probability of presenting a "standard" stimulus is 0.8, and the probability of each "deviation" stimulus and "new" stimulus is 0.1.
QEEGキャップ

QEEG cap with 22 electrodes including A1-, A2-, Oz- and FPz electrodes.
All electrodes made of sintered Ag/AgCl for low impedance and low noise EEG measurements.
The cap can be secured via the chin strap or (for sensitive patients or long electroencephalogram recordings) chest strap.


Easy-to-use software for recording QEEG/ERP. High frequency/low frequency/notch filter functions can be used. During measurement, the green mark to the right of each electrode monitors the degree of commercial AC noise contamination.
ERP rec ソフトウエアー 日本語対応
Easy-to-use software for recording QEEG/ERP. High frequency/low frequency/notch filter functions can be used. During measurement, the green mark to the right of each electrode monitors the degree of commercial AC noise contamination.
Easy-to-use software for recording QEEG/ERP. High frequency/low frequency/notch filter functions can be used. During measurement, the green mark to the right of each electrode monitors the degree of commercial AC noise contamination.
Hbimed 解析ソフトウエアー

Easy-to-use software for recording QEEG/ERP. High frequency/low frequency/notch filter functions can be used. During measurement, the green mark to the right of each electrode monitors the degree of commercial AC noise contamination.

Easy-to-use software for recording QEEG/ERP. High frequency/low frequency/notch filter functions can be used. During measurement, the green mark to the right of each electrode monitors the degree of commercial AC noise contamination.

Easy-to-use software for recording QEEG/ERP. High frequency/low frequency/notch filter functions can be used. During measurement, the green mark to the right of each electrode monitors the degree of commercial AC noise contamination.

Easy-to-use software for recording QEEG/ERP. High frequency/low frequency/notch filter functions can be used. During measurement, the green mark to the right of each electrode monitors the degree of commercial AC noise contamination.

Easy-to-use software for recording QEEG/ERP. High frequency/low frequency/notch filter functions can be used. During measurement, the green mark to the right of each electrode monitors the degree of commercial AC noise contamination.

Easy-to-use software for recording QEEG/ERP. High frequency/low frequency/notch filter functions can be used. During measurement, the green mark to the right of each electrode monitors the degree of commercial AC noise contamination.

Easy-to-use software for recording QEEG/ERP. High frequency/low frequency/notch filter functions can be used. During measurement, the green mark to the right of each electrode monitors the degree of commercial AC noise contamination.

Easy-to-use software for recording QEEG/ERP. High frequency/low frequency/notch filter functions can be used. During measurement, the green mark to the right of each electrode monitors the degree of commercial AC noise contamination.

Easy-to-use software for recording QEEG/ERP. High frequency/low frequency/notch filter functions can be used. During measurement, the green mark to the right of each electrode monitors the degree of commercial AC noise contamination.


Easy-to-use software for recording QEEG/ERP. High frequency/low frequency/notch filter functions can be used. During measurement, the green mark to the right of each electrode monitors the degree of commercial AC noise contamination.

Easy-to-use software for recording QEEG/ERP. High frequency/low frequency/notch filter functions can be used. During measurement, the green mark to the right of each electrode monitors the degree of commercial AC noise contamination.


Easy-to-use software for recording QEEG/ERP. High frequency/low frequency/notch filter functions can be used. During measurement, the green mark to the right of each electrode monitors the degree of commercial AC noise contamination.


Easy-to-use software for recording QEEG/ERP. High frequency/low frequency/notch filter functions can be used. During measurement, the green mark to the right of each electrode monitors the degree of commercial AC noise contamination.


参考論文
